







When wholesale crop prices fall, grocery shoppers often expect an immediate discount at the checkout counter. Yet retail food bills rarely move in lockstep with the agricultural cash market. Tracking federal data shows that the value of raw farm output makes up only a modest portion of what a household pays at the register, leaving a wide gap between farm-gate trends and supermarket receipts.
Farms received 18.5 cents of each dollar spent on food at home in 2024, leaving more than 81 cents to cover processing, shipping, and retail operations.
What the farm-to-retail spread measures
Federal researchers analyze grocery economics by tracking what is known as the price spread. The USDA Economic Research Service compares the retail prices consumers pay for food items in supermarkets and supercenters with the prices farmers receive for matching agricultural commodities. The mathematical difference between those two values represents the farm-to-retail spread. In plain terms, it measures the gross margin required to move food from an agricultural field into a consumer shopping cart.
To interpret this spread, the federal government divides each consumer food dollar into two distinct buckets: the farm share and the marketing share. The farm share represents the value of sales by farm establishments for each dollar spent on food. The marketing share is the remainder. That remainder covers everything that happens after the harvest, including commercial food processing, packaging, wholesaling, trucking, refrigeration, and retail store management. Because the marketing share absorbs the vast majority of consumer spending, a dramatic swing in farm-gate prices influences only a small component of the finished retail price.
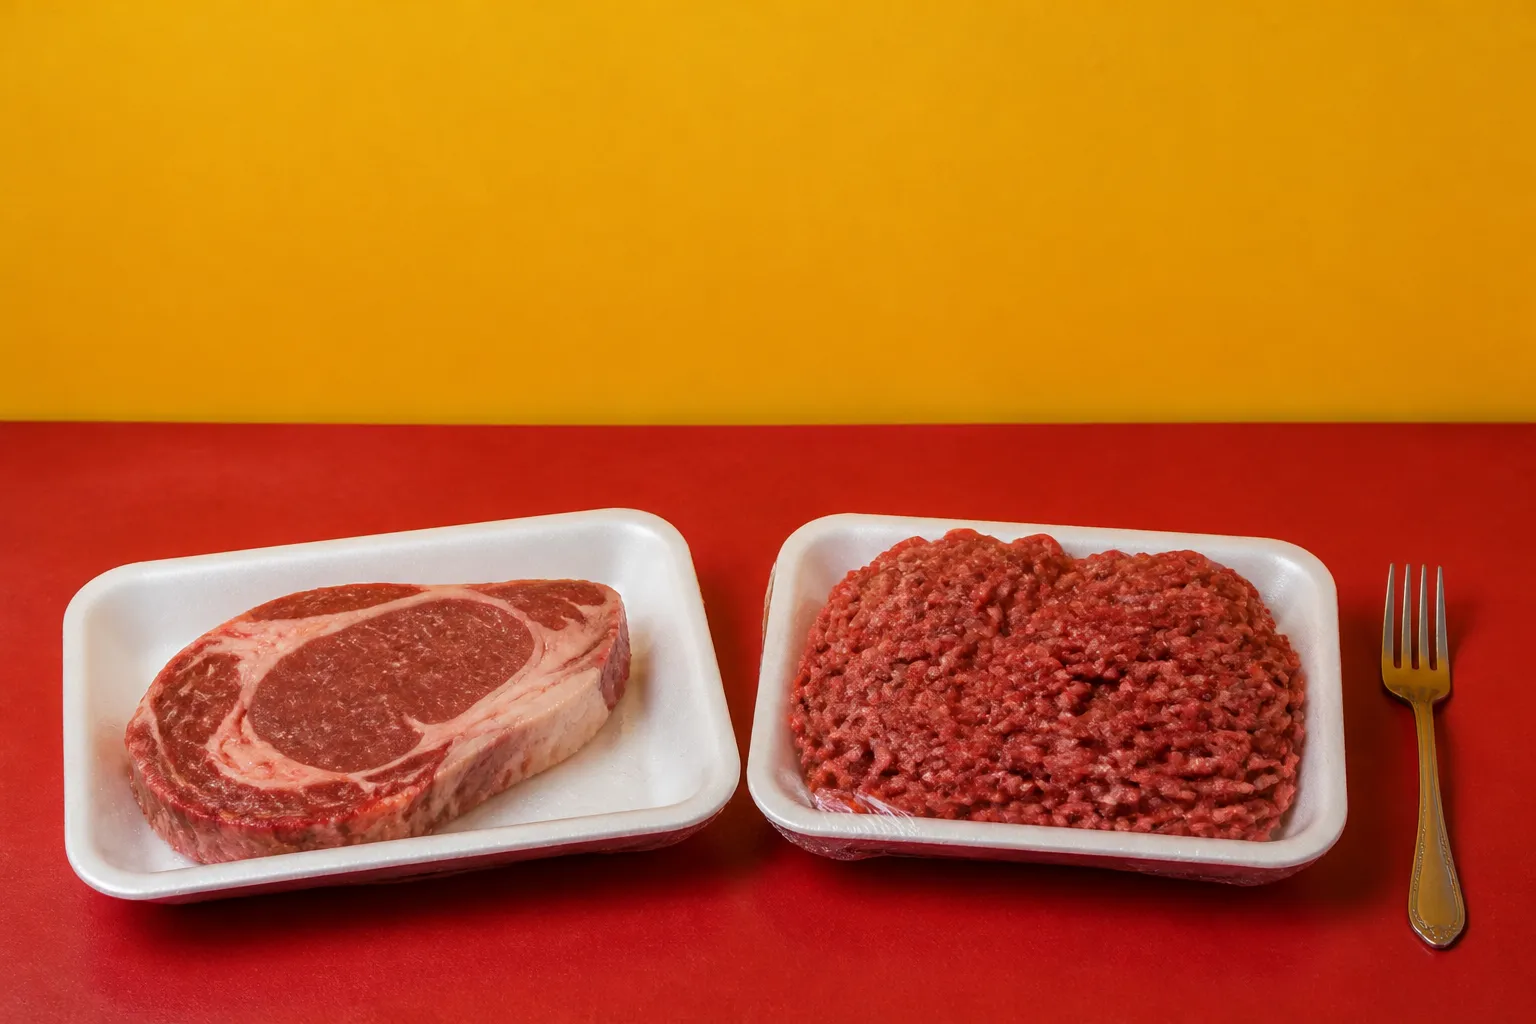
Commercial processors and distributors create economic value by converting raw agricultural goods into safe, ready-to-use products. Wheat must be milled into flour and baked into bread. Cattle must be slaughtered, dressed, graded, cut, cold-stored, and hauled across state lines. The value added by these intermediate steps accounts for a substantial portion of consumer food prices. When you buy groceries, you are primarily purchasing post-harvest marketing services rather than raw commodities.
Why a commodity drop may not reach the shelf quickly
Retail food prices reflect several distinct layers of cost acting simultaneously. Labor expenses, diesel fuel, electricity, commercial refrigeration, cardboard packaging, and wholesale raw ingredients all feed into the price listed on the shelf tag. As the Economic Research Service points out, long-run trends in farm-to-consumer spreads reflect changes in technology used to process and distribute food alongside price shifts in labor, energy, and raw commodities. If the wholesale price of grain drops, but the cost of refrigerated transit, warehouse labor, and paperboard boxes increases, the final price at the grocery store may hold flat or even climb.
Federal price-spread data documents these cost splits, but it does not track the specific day-to-day mechanisms that cause retail prices to lag behind farm-gate drops. Government statistical tables do not measure a standard timeline for how long it takes a wholesale discount to reach a neighborhood store. Consumers should view any simple claims about fixed pass-through timelines with caution. The official reports describe aggregate annual structures and national market baskets rather than the calendar schedules of individual retail pricing departments.
Outside economic observers often point to practical trade realities to explain the gap. Food processors sign long-term procurement contracts months in advance, locking in raw ingredient costs before a spot-market drop takes place. Supermarkets also sell inventory purchased under earlier wholesale price schedules. These operational factors slow down price transmission, but federal spread reports do not quantify how much each factor contributes to a delay.
Reading the recent numbers carefully
Examining the actual distribution of food spending helps put the math into perspective. In 2024, farms received 18.5 cents per dollar spent on food at home. The marketing share for those grocery purchases stood at 81.5 cents per dollar. For food away from home, such as dining at restaurants or eating at school cafeterias, farms received only 7.1 cents per dollar, while the marketing share reached 92.9 cents. Commercial dining establishments require significant labor, commercial kitchen equipment, and dining-room space, which increases the non-farm share of every meal served.
Consumer price measurements examine these retail costs from a different angle. According to the ERS Food Price Outlook, the food-at-home consumer price index rose 0.1 percent from August to September 2026 and stood 1.8 percent higher than in September 2025. Across the wider market, the all-food index was up 2.5 percent year over year, while the broader all-items index rose 0.6 percent from August to September 2026 and was up 3.7 percent over September 2025.
Shoppers must take care not to mix these distinct federal datasets together. The monthly consumer price indexes track shifts in urban retail living expenses over fixed periods, while farm-share reports analyze the annual allocation of gross revenue across marketing stages. The monthly outlook reports do not supply matching farm-level commodity prices for the exact same calendar periods, which prevents a clean, one-to-one comparison of farm price changes against retail store tags.
Checking which data you are looking at
Before drawing conclusions from public discussions about food inflation, identify which statistical measure is being quoted. Federal agencies build annual market baskets designed to represent what an average American household purchases at retail over a full calendar year. Researchers compare the total retail cost of that basket with the farm value of an equivalent group of agricultural commodities. However, the agency also tracks individual food items separately, and it applies a different statistical method to compute monthly spreads for beef, pork, broilers, turkeys, and eggs. Blending monthly meat figures with annual market-basket figures produces distorted conclusions.
Methodological updates also alter how historical tables should be read. ERS updated its Food Dollar series in 2026 using an adjusted model and refreshed calculation methods. Because of those updates, results published under the 2026 model cannot be compared directly with figures published in earlier release cycles. Comparing a pre-2026 report with a 2026 table will create the illusion of a trend that may simply stem from altered mathematical modeling.
Finally, always confirm whether a dataset tracks food at home or food away from home, and verify that both the farm data and the retail data span the identical time window. Grocery store purchases operate on an 18.5-cent farm baseline, while restaurant purchases operate on a 7.1-cent baseline. Verifying the reporting period, category, and statistical model is the most dependable way to interpret retail spreads and understand why commodity dips rarely create rapid bargains in the grocery aisle.