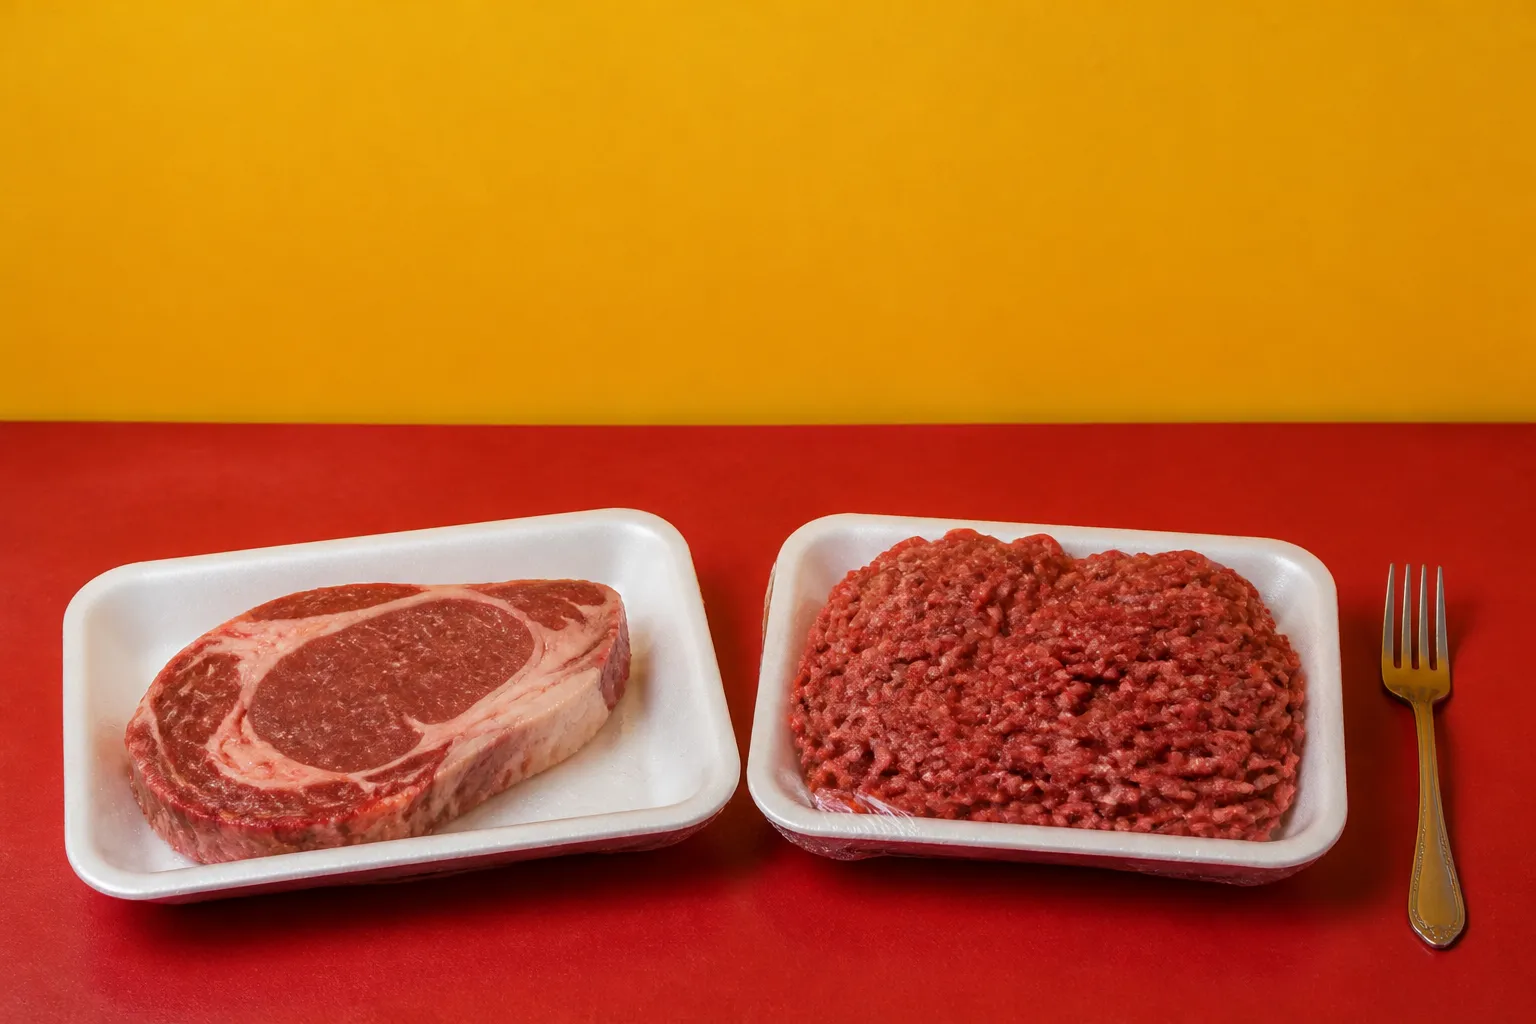
A shopper stands at the meat case. Ribeye has crept up again. Ground beef has not. She puts the steak back and takes the tray of ground beef. That small swap is the heart of a long technical argument about how inflation should be measured, and it is why two gauges, headline CPI and chained CPI, get compared so often.

The two gauges, and what we can and cannot say about them
Headline inflation usually means the Consumer Price Index for All Urban Consumers, or CPI-U. When a news story says prices rose a certain percent over the past year, this is typically the figure behind it. The Bureau of Labor Statistics also publishes a chained version, the C-CPI-U. The agency has an introduction to the chained consumer price index and a questions and answers page for it.
Here is the limit of this article. The copies of those two pages available to us were cut off before any substantive text. We could not read how the chained index is built, so we will not describe its formulas or claim to know how big its difference from headline CPI is. Readers who want the mechanics should open the BLS pages directly.
Why the trade-down question matters
The debate starts with a simple idea. When relative prices change, people change what they buy. If ribeye gets expensive and ground beef does not, some households will switch. A measure that treats the shopping cart as fixed and one that tries to follow the switch could tell different stories about how fast living costs are rising.
That is the premise people on both sides argue from. Where they split is on what follows. One camp says a measure that reflects switching is simply more accurate. The other says it can hide real hardship, because a family eating ground beef instead of steak has lost something even if its grocery bill held steady. Neither claim can be tested here. The material we have does not include worked examples of how large the switching effect is, or how either index handles it in practice.
That gap matters. Without numbers, a claim about trade-down is only an argument. It may be a good argument, but it should be read as one.
Methodology changes make long comparisons shaky
Even the headline index has not stayed the same over time. BLS publishes a research series, CPI-U-RS, that applies current methods back to 1978. According to the third-party site Reality Index, BLS's publication of that series acknowledges that headline CPI figures from 1978 onward were not built on one consistent methodology. We have not verified that wording against the BLS document itself. Still, the point is plain. A comparison of inflation across decades may be comparing different measuring rules.
The housing example shows how this works. Reality Index reports that in January 1983 the CPI-U replaced its earlier user-cost approach to owner-occupied housing with Owner's Equivalent Rent, and that CPI-W followed in January 1985. It says BLS justified the change by treating a home as a capital good, so the index should measure only the service of shelter that the home provides. Those dates and that rationale come from the third-party site, not from a BLS page we could read.
The weight of shelter, and a critic's complaint
Housing matters here because of its size. Reality Index's timeline of CPI methodology changes says housing services make up roughly 33 percent of CPI, and Owner's Equivalent Rent alone about 24 percent, the largest single line in the index. Those figures are the site's, and we could not check them against a government table.
The same site also presents a critic's view. It argues that replacing home prices with equivalent rents lowers reported housing inflation when home prices rise faster than rents, and that the cumulative effect of such changes understates what families experience. The site is advocating a position here, and it is not a neutral reference. Whether the claim holds depends on data the page asserts but that we have not seen laid out.
We also found nothing in these sources on whether the 1983 housing change or other methodology shifts apply to the chained index, or how. That is an open question, not a settled one.
Questions to ask when you see the two indexes compared
Any article, chart or think-tank paper that sets headline CPI against chained CPI is worth a few checks.
- Does it use the unadjusted headline series or CPI-U-RS, and does it say which method applies to each year?
- Does it show the data behind a claim that measurement changes understate family costs, or only assert it?
- Does it cite the full BLS documentation for the chained index, or a summary of it?
These questions will not settle the debate. They do help separate a documented number from a position. The ribeye-to-ground-beef swap is real, and economists agree it is worth measuring. How best to count it, and what it says about a family's well-being, is still contested, and the sources we could read do not resolve it.