










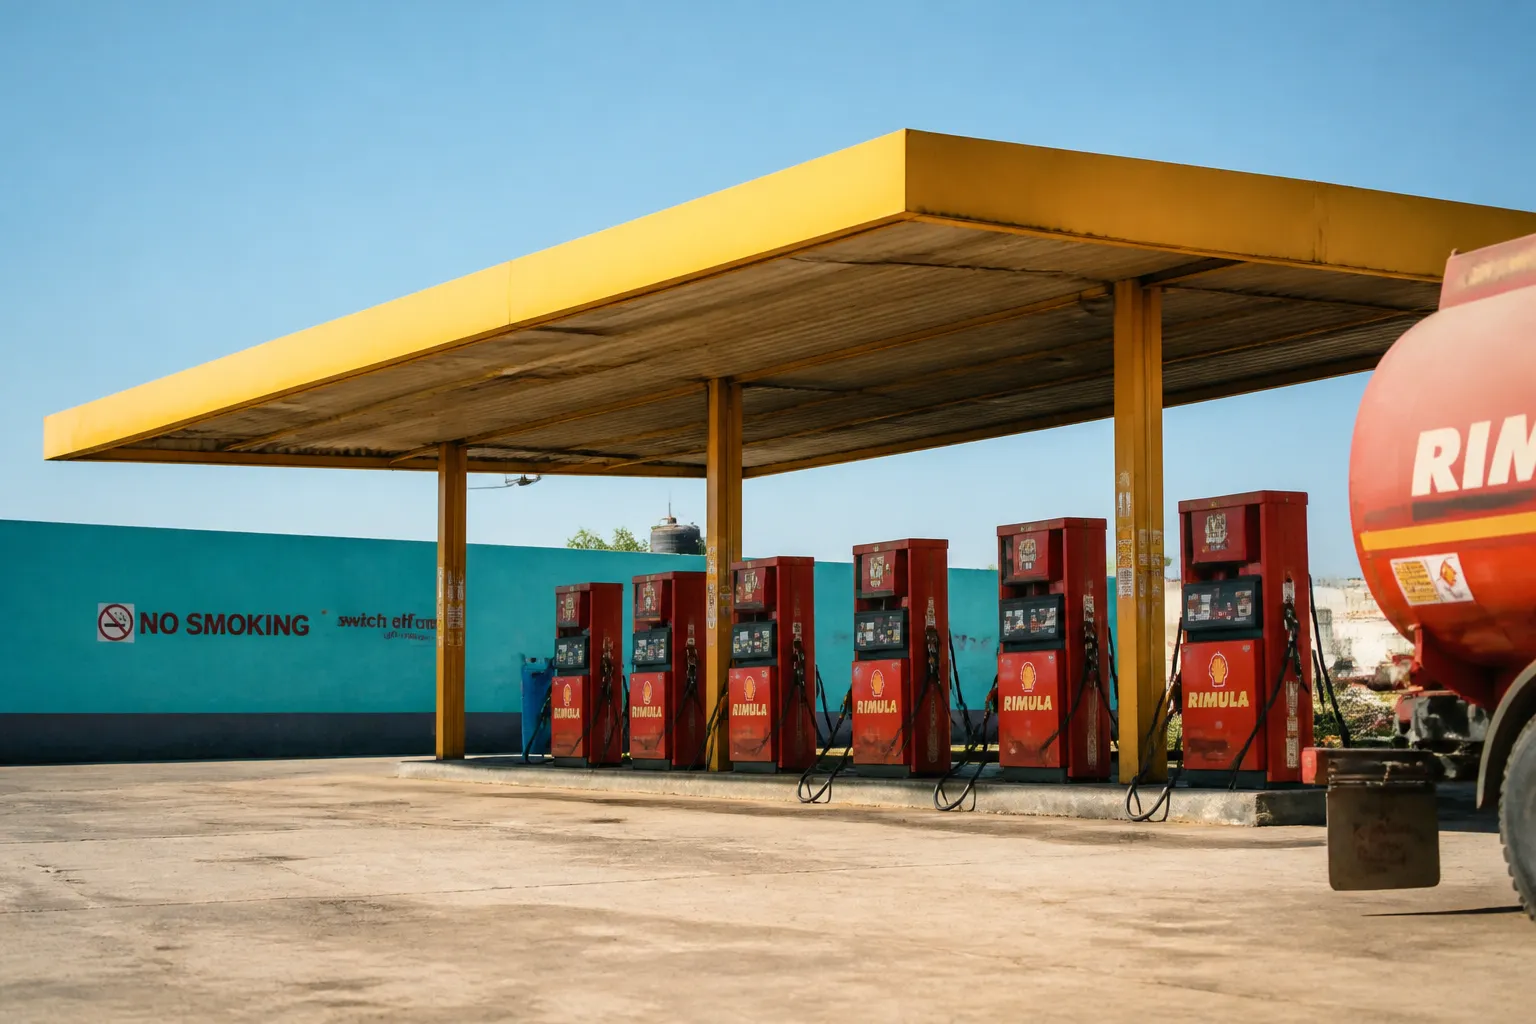
A gallon of gasoline at a retail station looks like a single item on a receipt, but its price is built from four distinct pieces: crude oil, refining, distribution and marketing, and federal and state taxes. Each segment responds to different economic pressures. When a driver sees a price tick upward or downward from one Tuesday to the next, it is rarely the result of a single company setting rates at will. Tracking how these four layers behave explains why pump prices can shift even when local station costs appear completely flat.
Retail fuel costs move primarily with the price of crude oil and wholesale margins, but the final dollar amount on the pump sign is split among four distinct stages of production and delivery.

What makes up the price at the pump
The total retail price of motor fuel is routinely separated into four broad cost buckets. Crude oil is the raw input, refining turns that crude into usable motor fuel, distribution and marketing gets the finished fuel to the station, and government taxes are levied at both the federal and state levels. Federal analysis and trade publications agree on these four categories, but the exact share that each category claims can shift depending on when and how the data is measured.
Crude oil consistently represents the largest single component of retail gasoline. Because crude is bought and sold on international commodities exchanges, its price reflects global supply, international trade flows, and production targets set by major producing nations. When crude prices climb or drop on global markets, pump prices in the United States generally follow that path within a matter of weeks, according to data outlined by the American Petroleum Institute.
The published shares for each layer vary across industry releases. In one industry summary citing Energy Information Administration (EIA) figures from late 2025, crude oil accounted for roughly 47% of the retail price, refining made up 16%, distribution and marketing represented 20%, and taxes took 17%. Yet a separate industry overview published in May 2026, also citing EIA measurements, reported crude oil at about 51%, refining at 20%, distribution and marketing at 11%, and taxes at 18%, as detailed in their retail price breakdown. These conflicting splits show that percentage estimates are moving targets. Anyone evaluating pump prices should view individual shares as general estimates rather than fixed formulas.
How refining and distribution add cost
Once crude oil is extracted from the ground, it must be processed at a refinery to become motor fuel. Refining costs vary throughout the year because of changing fuel specifications, regional clean-air mandates, and operating expenses. Refineries also purchase additives, such as fuel-grade ethanol, which are blended into finished gasoline to meet federal environmental standards. Operating in a state with strict environmental rules requires specialized processing equipment, which raises the base cost of producing a gallon of fuel.
Seasonality creates a regular shift in refining operations. As temperatures rise in the spring, refineries switch from winter-grade gasoline to summer-grade gasoline. Summer blends have a lower Reid vapor pressure, which means they evaporate less easily in hot weather and reduce smog formation. These blends require more complex processing steps and more expensive blending components. Historical data from the U.S. Energy Information Administration shows that in the spring of 2018, regular gasoline jumped 22 cents per gallon, or about 8%, between April and late May, largely driven by this annual transition to summer-grade fuel.
After leaving the refinery gate, gasoline must travel through supply chains to reach individual pumps. Pipelines provide the most cost-effective transportation, but not all parts of the country have direct pipeline access. Areas that rely on barges, rail tank cars, or long-distance tanker trucks pay higher delivery charges per gallon. Once fuel arrives at a local terminal and moves to a retail station, the station owner must cover real estate taxes, employee wages, merchant credit card processing fees, and equipment maintenance. Station competition along a specific commercial corridor also influences whether the retailer can pass those delivery and overhead costs directly to motorists.
Why prices change from week to week
Weekly price volatility at the pump often confuses consumers because local driving habits seem steady. Short-term movements, however, are pushed by wholesale market swings, regional inventory shifts, and consumer demand cycles. As warmer weather arrives, overall vehicle travel increases. During the spring of 2018, four-week average gasoline demand reached 9.4 million barrels per day in mid-May, creating tighter inventories that pushed pump prices higher nationwide.
Crude oil markets introduce additional instability. Because crude prices respond to production quotas, diplomatic tensions, shipping disruptions, and inventory reports, a price shock overseas ripples into domestic wholesale fuel contracts almost immediately. When federal and state excise taxes stay flat and local station operating costs do not change, sudden retail price swings are driven almost entirely by changes in crude oil prices and wholesale refining margins. Retail stations adjust their pump prices after a slight lag as they receive new fuel deliveries at the newer, higher or lower wholesale wholesale rack rate.
Why prices differ from place to place
Pump prices can differ significantly between neighboring states, and even between neighboring zip codes. These regional variations stem from three primary factors: local fuel formulations, transportation logistics, and state tax packages. Certain air-quality control areas require proprietary boutique fuel blends that cannot be easily swapped with fuel from neighboring jurisdictions, making those markets more vulnerable to local supply shortages.
The benchmark used to price crude oil also shapes domestic pump costs. Although West Texas Intermediate is the standard domestic crude benchmark in news reports, the EIA has noted that U.S. gasoline prices have historically tracked Brent crude, an international benchmark, much more closely. Regional pricing dynamics are cataloged on educational platforms like Wikipedia's fuel pricing summary, which notes that retail prices reflect national pricing policy, local taxation, and currency movements. However, general reference pages can carry outdated citations, making government tracking tables a safer source for regional comparisons.
What the sources cannot tell you
While the four-part framework explains the mechanics of retail fuel pricing, public data sets have clear limits that consumers must keep in mind. Industry estimates reported by the National Association of Convenience Stores indicate that retail gasoline purchases make up roughly 5% of household spending each year, with nearly 40 million Americans refueling daily. That statistic shows that fuel is an essential recurring expense, but it does not account for differences between long-distance rural commuters and city residents who use public transit.
Furthermore, the specific dollar amounts cited in federal case studies reflect historical baseline periods, such as the 2018 market where Brent crude averaged $78 per barrel and national retail fuel approached $2.92 per gallon. These figures illustrate how wholesale margins and seasonal blends interact, but they do not describe current price boards. State excise taxes also differ widely, ranging from modest flat fees per gallon to complex variable formulas tied to inflation or wholesale wholesale averages, which broad national studies omit. Drivers seeking an accurate picture of current pump expenses should check weekly updates from federal reporting agencies rather than relying on historical snapshots.


