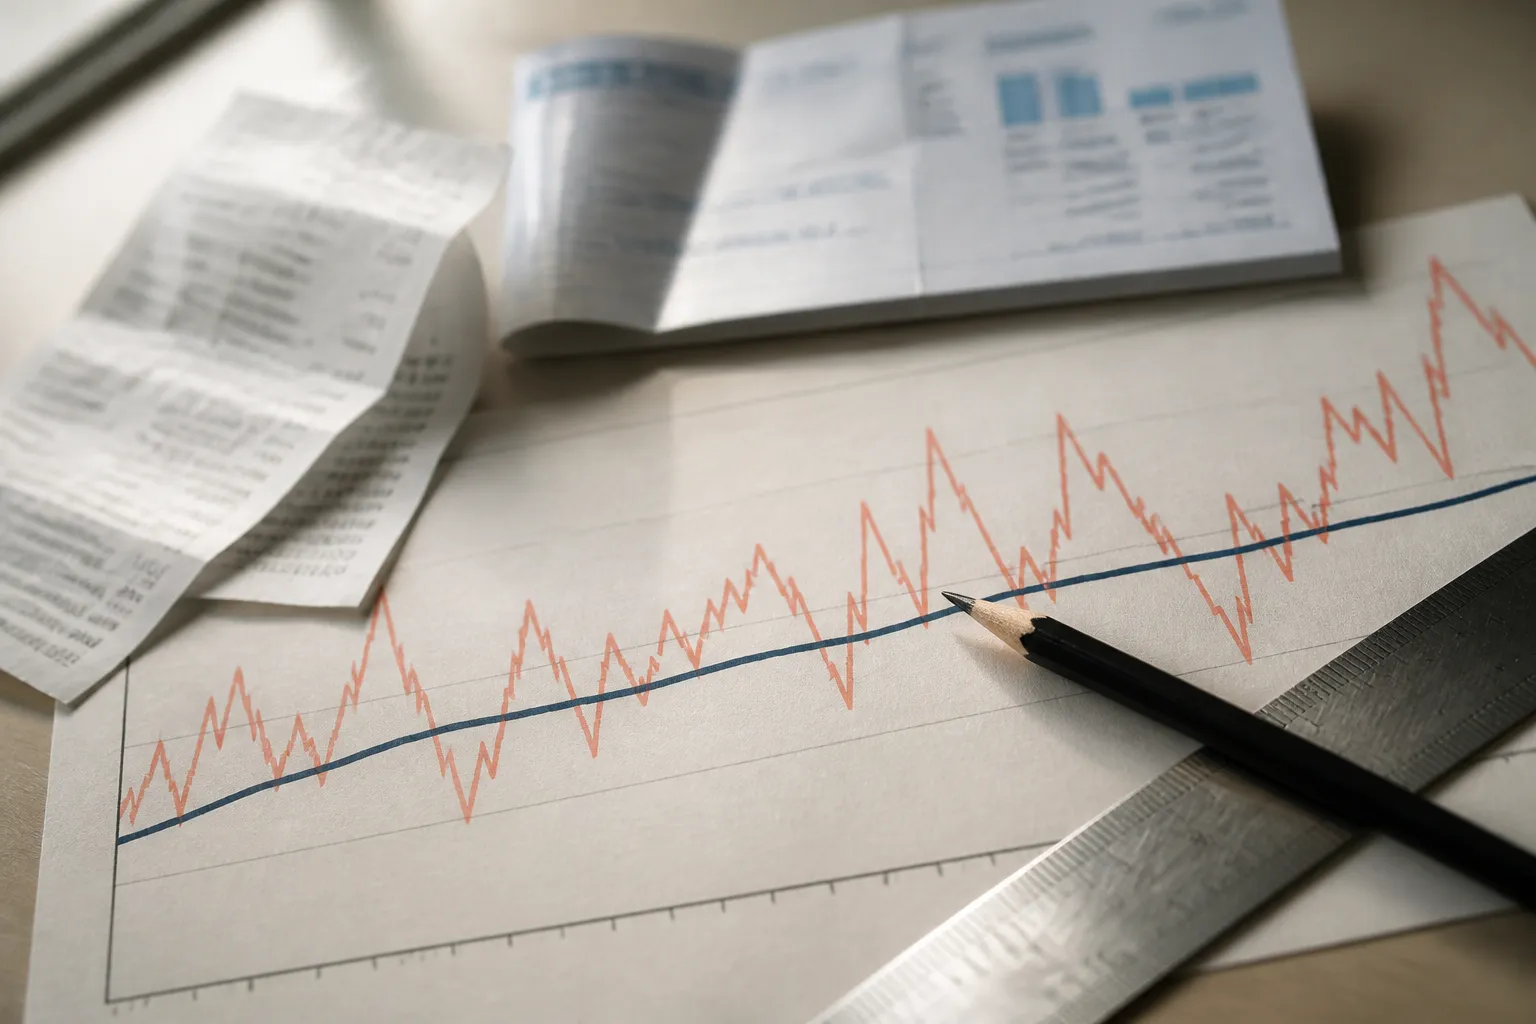
Monthly inflation reports usually carry two numbers. One covers the full basket of goods and services households buy. The other strips out food and energy and is called core inflation. The split exists so policymakers can see the underlying trend in prices, not just the temporary spikes that may soon reverse.
Food and energy prices can swing up and down more dramatically and more often than other prices.
What core inflation actually is
Core inflation is not one fixed calculation. It is a method that can be applied to several price measures, including the Consumer Price Index, the Personal Consumption Expenditures price index, or the GDP deflator. Each one covers different items and weights them differently. A core reading from one report can therefore differ from another.
So the first question is always which index you are looking at. A core CPI number and a core PCE number are related, but they are not the same thing. Comparing one to the other without checking is an easy way to draw the wrong conclusion. Say a news story quotes a core figure with no label. You cannot tell what it covers until you find the index behind it.
Why food and energy are excluded
Economists leave out food and energy because their prices are volatile. Crop-damaging weather can push food prices up for a season. A disruption in oil supply can lift fuel costs for a few months. According to the San Francisco Fed, these changes are more likely tied to temporary factors that may reverse later. You can read that explanation in its Doctor Econ answer on core inflation.
There is a second reason, and it concerns timing. Monetary policy affects prices with long and variable lags, on average over a couple of years, as the FRED Blog explains. The Fed wants a measure it can predict reasonably well. In that view, short-term swings in food and energy are not something the FOMC can respond to anyway. The FRED Blog also says core PCE has a better signal-to-noise ratio than those components, which fluctuate widely around it.
Energy is not fully walled off, though. The San Francisco Fed notes that a rise in energy prices relative to other prices can ripple into other goods. Oil-dependent items such as automobiles can become more expensive. Excluding energy removes the direct effect, not every indirect one.
Core PCE versus core CPI
Core PCE, also called the PCE price index excluding food and energy, is the measure the FRED Blog says the FOMC primarily focuses on. It is published by the Bureau of Economic Analysis as part of the monthly Personal Income and Outlays report. The BEA reported core PCE up 3.1% from a year earlier for September 2026. The figure was 3.0% for each of June, July and August 2026.
Core CPI comes from the Bureau of Labor Statistics and is widely used by economists for the same reason. Its index, seasonally adjusted, stood at 338.896 for September 2026 and 337.765 for August 2026, according to FRED. Note that this is an index level, not a percentage rate. The FRED Blog says PCE covers a broader set of household expenses than CPI, which is one reason the two can tell slightly different stories.
Limits for household budgets
Core inflation describes the underlying trend. It does not describe your total cost of living. Food and energy are big line items for many households, and core leaves both out. In a month when groceries or heating bills jump, a core reading may look calm while your own bills do not.
The sources reviewed here do not say how a household should adjust a budget for the omitted categories. Some practical checks are still straightforward.
- Ask whether a figure is headline or core, and which index it uses.
- Compare the headline number with the core number for the same month and index.
- Look at your own grocery and fuel receipts over a few months and see how they moved.
Headline inflation includes food and energy and reflects the full price level. Core shows the trend. Use core to understand where policy may be heading, and use headline and your own receipts to see what you actually pay. A simple habit works well here. Keep a running note of what you spend on groceries and fuel each month, then set it beside the published numbers.