











Headlines about auto prices, replacement components, and mechanical labor often bundle completely different metrics into a single sentence. A reader scanning the morning news might see one line declaring that maintenance bills reached an all-time peak, while another notes that new car prices barely budged over the past twelve months. These statements can both be statistically true while describing entirely different economic events. Untangling what is happening requires sorting the underlying data into four distinct categories before drawing conclusions about household spending.
- Price Index Levels: Statistical measurements tracking relative changes over a fixed baseline period, rather than raw dollar costs.
- Transaction Prices: The actual dollar amounts paid by vehicle buyers at the dealership after incentives, markups, and dealer fees.
- Sticker Prices: The suggested retail figures set by manufacturers, which indicate pricing strategy rather than final cleared payments.
- Insurance Claims Data: Metrics measuring the frequency, complexity, and total loss outcomes of collision repairs managed through insurers.
Start with the measure behind the headline
The most common error in reading automotive inflation coverage is treating an index value as a dollar figure. The Bureau of Labor Statistics (BLS) tracks maintenance and repair costs through the Consumer Price Index series for Motor Vehicle Maintenance and Repair, cataloged as CUUR0000SETD through the FRED platform at the Federal Reserve Bank of St. Louis. This series uses a base period from 1982 to 1984 set at an index level of 100. When the series registered 452.383 in May 2026, 457.313 in June, 460.185 in July, 465.136 in August, and 468.491 in September 2026, those numbers did not describe a $468 repair bill. They showed that the basket of labor and basic maintenance tracked by the agency was roughly 4.68 times more expensive than it was in the early 1980s.
It is equally necessary to separate transaction values from manufacturer suggestions. The average transaction price (ATP) captures the actual net amount paid by buyers, whereas the manufacturer's suggested retail price (MSRP) is merely the sticker price. According to market reporting from Cox Automotive on Kelley Blue Book data, the average new-vehicle ATP climbed to $50,562 in September 2026, while the average MSRP stood higher at $52,342. A story focusing on sticker prices might suggest that vehicles are becoming out of reach, while a report on transaction prices could show buyers negotiating steeper discounts or opting for more basic trims. Both reports rely on valid data, but they answer different questions.
Readers should also note that federal methodology details require careful verification. The official BLS documentation pages for new vehicle price measurement, the associated research methodology factsheet, the used cars and trucks methodology, and motor vehicle insurance index tracking frequently experience site navigation updates. When articles summarize these indexes without linking directly to the underlying calculation standards, verifying the primary tables directly on official statistical portals prevents misinterpreting how vehicle depreciation or quality adjustments enter the figures.
Read the time comparison in the story
How an author frames time periods completely alters the tone of an inflation story. Consider the September 2026 new-vehicle sales figures. The transaction average of $50,562 rose 0.9% compared to the August figure of $50,089, marking the fourth straight monthly increase. If a writer chooses to emphasize that monthly step, the trend sounds persistent and aggressive. Yet looking at the same data across a twelve-month horizon tells an opposite story: the figure rose only 0.7% compared to September 2025. In historic context, a typical year-over-year price gain for new cars in September falls between 2% and 4%. By that standard, annual price growth was unusually flat.
A third common framing is the comparison against an all-time record. In December 2025, the new-vehicle ATP reached an all-time peak of $50,614. At $50,562 in September 2026, the market was just $52 below that peak. One writer can accurately headline a piece by stating that car prices are hovering within dollars of the highest level ever recorded. A second writer can report with equal accuracy that car prices grew by less than 1% over the past year, trailing broader inflation. Readers must check whether a headline is citing a single-month change, a trailing annual comparison, or an extreme historic benchmark before assessing whether costs are accelerating or stabilizing.
Check the source and its scope
Federal price statistics and commercial industry releases serve different functions and observe different populations. The BLS produces broad consumer price indexes designed to sample price shifts across representative urban households nationwide. Commercial data vendors, by contrast, focus on specific transaction feeds or insurance carrier databases. For example, CCC Information Services tracks auto physical damage metrics based on insurance claims files, as summarized in the CCC Mid-Year Update and industry coverage in CollisionWeek.
Understanding what an industry firm measures is critical to interpreting its claims. CCC reported that insurance claims frequency through September dropped 3.5%, following an 8.3% drop during the same period a year earlier. In addition, repairable collision estimates fell 5.4%, and comprehensive claims dropped 9.2% due to fewer car thefts and limited weather catastrophe events. A hurried reader might assume that falling claim counts mean auto repairs are becoming cheaper. In reality, CCC pointed out that the remaining claims were older, costlier, and far more technically complex, while total loss valuations ticked up 1.1%.
Readers must also watch for restricted or incomplete releases. Articles from trade publications often summarize reports that sit behind paywalls or member logins. In some cases, published summaries truncate figures mid-sentence, such as total loss valuation shifts after comparative percentage changes. Relying on an incomplete summary of an industry sample can create an inaccurate picture of general market conditions.
Connect the numbers to a household budget
A statistical average across an entire country rarely mirrors what an individual pays at an independent repair shop or dealership. When news coverage notes that the average transaction price sits above $50,000, that aggregate figure includes luxury utility vehicles, heavy-duty work trucks, and entry-level compact cars. In the late summer data, stronger sales of affordable subcompact crossovers, compact passenger cars, and mid-size pickups actively suppressed the overall index, even while high-end trims became more expensive.
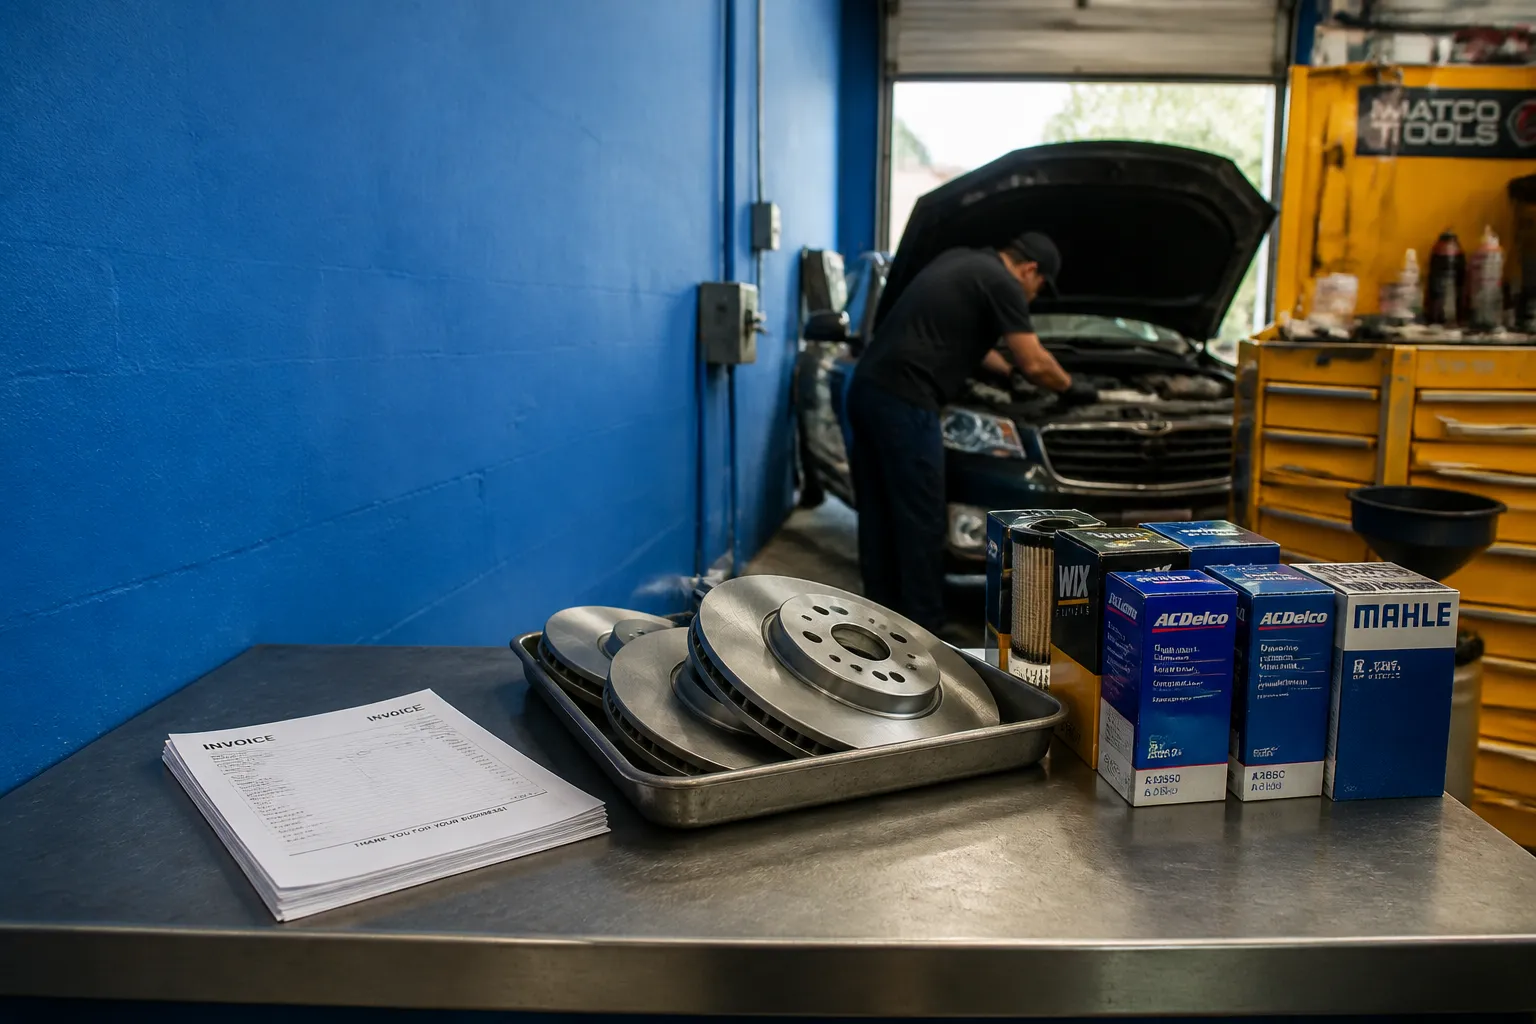
Furthermore, broader indexes do not report the line-item costs found on an automotive invoice. The FRED repair series does not report average hourly labor rates in your county, nor does it isolate the retail markup on replacement brake rotors or headlights. Similarly, the industry claims data compiled by CCC reflects vehicles covered by personal auto policies rather than everyday retail work. When auto deductibles increase, drivers often absorb smaller dents and minor bumper repairs out of pocket instead of filing formal insurance claims. This behavioral shift removes minor bills from insurer databases, making insurance-tracked repairs look artificially severe while household maintenance spending quietly rises outside official insurance tallies.
Use a short checklist when reading car and repair inflation news
To evaluate automotive inflation stories systematically, run through three basic questions whenever a new report appears:
- Is the figure seasonally adjusted? The FRED series for motor vehicle maintenance and repair is not seasonally adjusted. Repair demand, vehicle travel miles, and parts availability follow natural seasonal patterns throughout the summer driving season and winter months. Unadjusted data will reflect these regular seasonal spikes and dips.
- What exact metric and slice of the fleet is covered? Identify whether the writer is citing an index level, a suggested retail sticker price, a realized transaction average, or claim counts from collision insurers. Notice whether the data covers every vehicle or isolates a specific category, such as electric models or full-size pickups.
- When was the underlying data collected and published? Check the reporting window. The FRED CUUR0000SETD series was updated on October 14, 2026, with the next release slated for November 10, 2026. A news report published between release windows might rely on trailing figures that do not capture the most recent market shifts.
By identifying the exact data series, noting the comparison period, and recognizing the boundary between commercial repair claims and household retail spending, consumers can read automotive price news with clarity and discipline.


